Supertrend Indicator – The Trend Companion
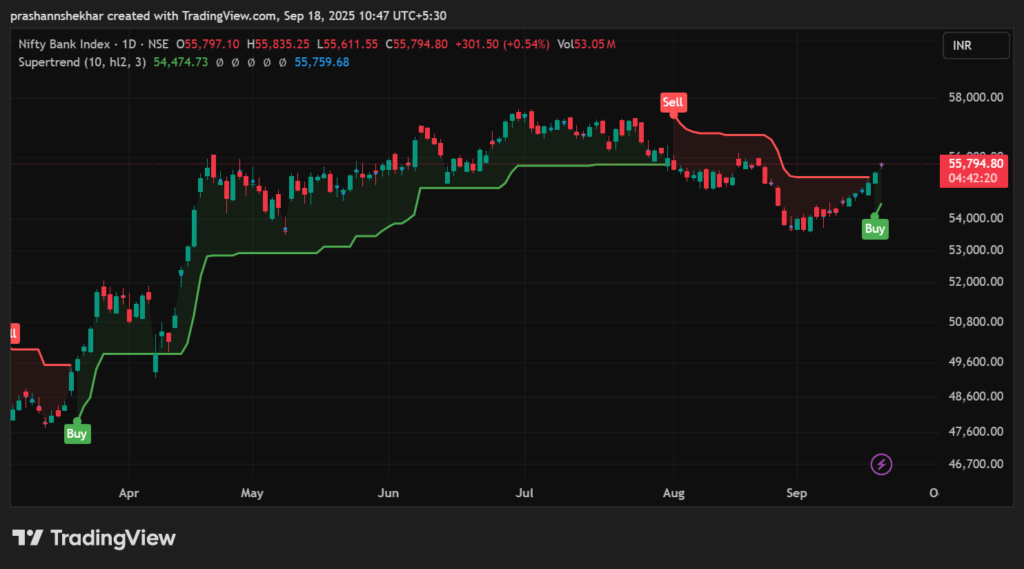
📌 Introduction In trading, the trend is your best friend. But how do you know when a trend is changing? That’s where the Supertrend Indicator comes in. The Supertrend is a trend-following indicator that gives clear buy and sell signals directly on the chart. It works well in intraday, swing, and positional trading. 🔹 What is the Supertrend Indicator? The Supertrend Indicator is based on Average True Range (ATR), which measures volatility. It works best in trending markets but can give false signals in sideways markets. 🔹 How Does Supertrend Work? The Supertrend has two main parameters: 👉 Formula: 🔹 Best Supertrend Settings 💡 Tip: Always backtest before applying to live trades. 🔹 How to Use Supertrend – Buy & Sell Signals ✅ Buy Signal ❌ Sell Signal 🔹 Supertrend Trading Strategies 1. Supertrend + Moving Average 2. Supertrend + RSI 3. Dual Supertrend Strategy 🔹 Pros & Cons of Supertrend ✅ Advantages ❌ Limitations 📊 Conclusion The Supertrend Indicator is one of the simplest and most effective tools for traders. It helps identify the direction of the trend and gives clear entry and exit signals. 👉 For best results: 📌 Disclaimer: This blog is for educational purposes only. ArthVed 9X is not a SEBI-registered advisor. Please consult your financial advisor before making investment decisions.