📌 Introduction
Every trader dreams of catching that big move when a stock suddenly surges or falls with strong momentum. These moves usually happen during a breakout or breakdown.
A breakout occurs when the price moves above a defined resistance level, while a breakdown happens when the price falls below a support level. Both are powerful signals for traders, especially in intraday and swing trading.
🔹 What is a Breakout in Trading?
A breakout happens when the stock price moves above a resistance level with higher-than-average volume.
👉 Example: If Nifty has been struggling to cross 20,000 for weeks and suddenly breaks above it with strong volume → breakout.
- Breakouts signal the start of a new bullish trend.
- Traders look for buy entries after confirmation.
🔹 What is a Breakdown in Trading?
A breakdown is the opposite of a breakout. It happens when the stock price falls below a support level with strong selling pressure.
👉 Example: If Bank Nifty is holding at 45,000 but crashes below that level with heavy volume → breakdown.
- Breakdowns signal the start of a new bearish trend.
- Traders look for short-selling opportunities.
🔹 How to Identify Breakouts and Breakdowns
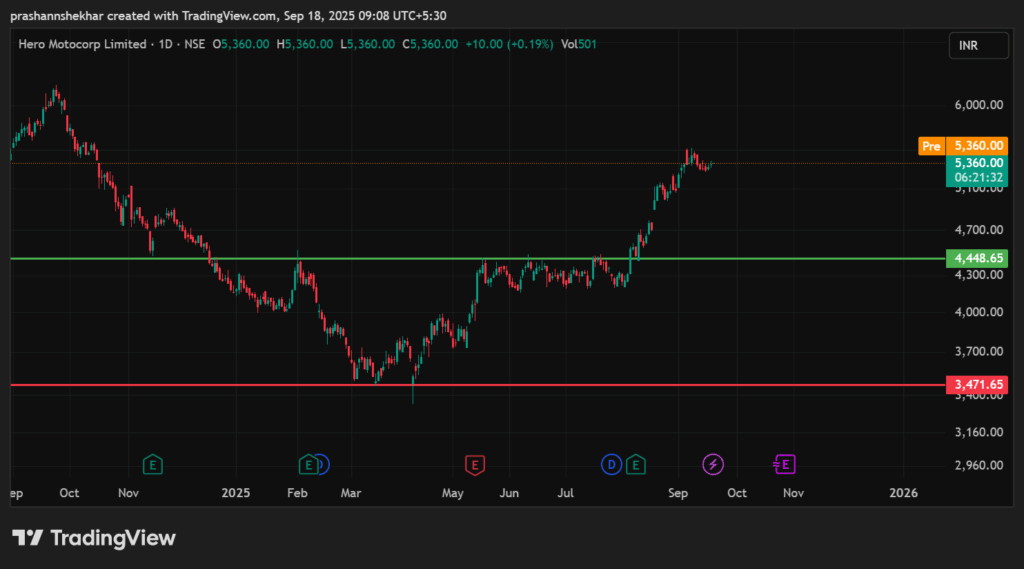
- Support and Resistance Levels
- Breakout → above resistance.
- Breakdown → below support.
- Chart Patterns
- Breakouts often happen from triangles, flags, and ranges.
- Breakdowns happen from head & shoulders, double tops, or rectangles.
- Volume Confirmation
- Strong breakouts/breakdowns usually come with higher-than-average volume.
- Weak breakouts without volume often fail (false breakouts).
🔹 Popular Breakout & Breakdown Strategies
1. Range Breakout Strategy
- Identify a stock consolidating in a range.
- Place buy order above resistance (breakout) or sell order below support (breakdown).
- Confirm with a volume spike.
2. Chart Pattern Breakouts
- Ascending Triangle → Bullish Breakout.
- Descending Triangle → Bearish Breakdown.
- Flag and Pennant → Continuation breakout.
3. Retest Strategy (Safer Entry)
Many traders prefer waiting for a retest after a breakout/breakdown.
Example:
- Stock breaks above ₹500 resistance, goes to ₹510, then comes back to ₹500 and holds → buy entry.
- This reduces false breakout risk.
4. Breakout with Indicators
Combine breakouts with other indicators:
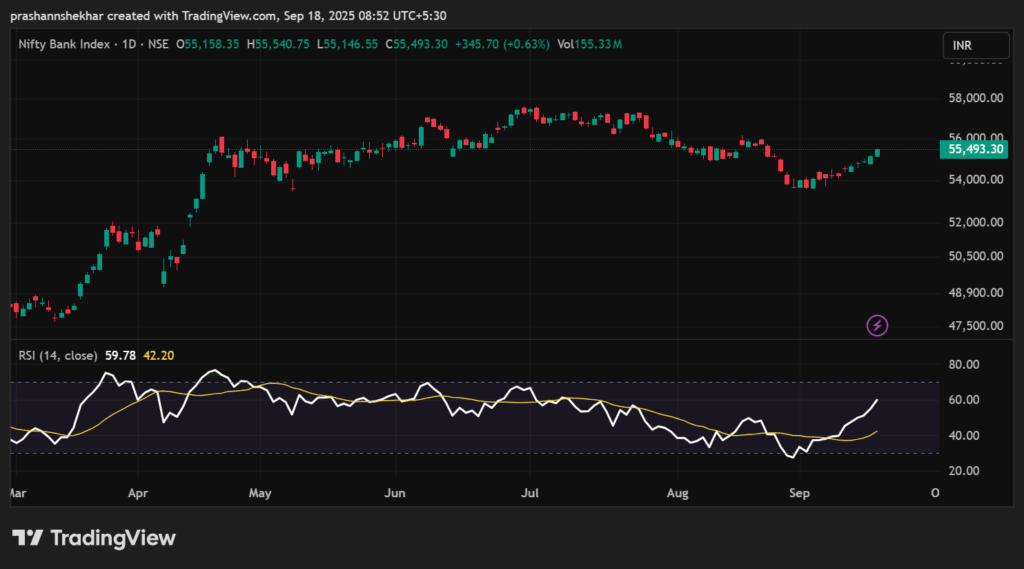
- Breakout + RSI above 55 → stronger confirmation.
- Breakdown + RSI below 45 → higher probability trade.
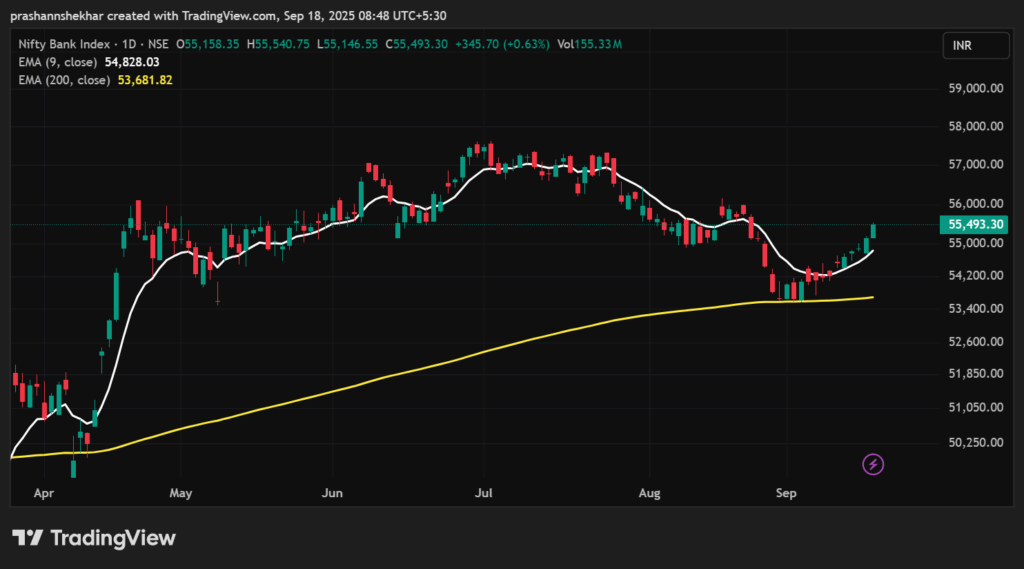
- Moving Averages can be used to filter false signals.
🔹 Common Mistakes Traders Make
❌ Jumping in without volume confirmation.
❌ Ignoring false breakouts (traps by big players).
❌ Not setting stop-loss (breakouts fail often).
❌ Entering late after the move is already gone.
🔹 Risk Management in Breakout Trading
- Always place a stop-loss just below the breakout level (for buys) or above the breakdown level (for sells).
- Risk:Reward ratio should be at least 1:2.
- Avoid trading every breakout — focus on liquid stocks with volume.
📊 Conclusion
Breakouts and breakdowns are among the most profitable setups in trading when used with discipline. By combining support/resistance, chart patterns, and volume analysis, traders can catch big trending moves early.
👉 But remember: Not all breakouts succeed. Always manage risk with stop-loss and wait for confirmation.
📌 Disclaimer: This blog is for educational purposes only. ArthVed 9X is not a SEBI-registered advisor. Please consult your financial advisor before making investment decisions.