📌 Introduction
One of the most powerful tools in technical analysis is the MACD (Moving Average Convergence Divergence) indicator.
It helps traders identify trend direction, strength, and momentum shifts.
Whether you’re an intraday trader or a swing trader, MACD can help you spot early trading opportunities with high accuracy.
🔹 What is MACD?
The MACD Indicator is a momentum and trend-following indicator developed by Gerald Appel.
It is based on the difference between two exponential moving averages (EMAs).
👉 Formula:
- MACD Line = 12 EMA – 26 EMA
- Signal Line = 9 EMA of MACD Line
- Histogram = MACD Line – Signal Line
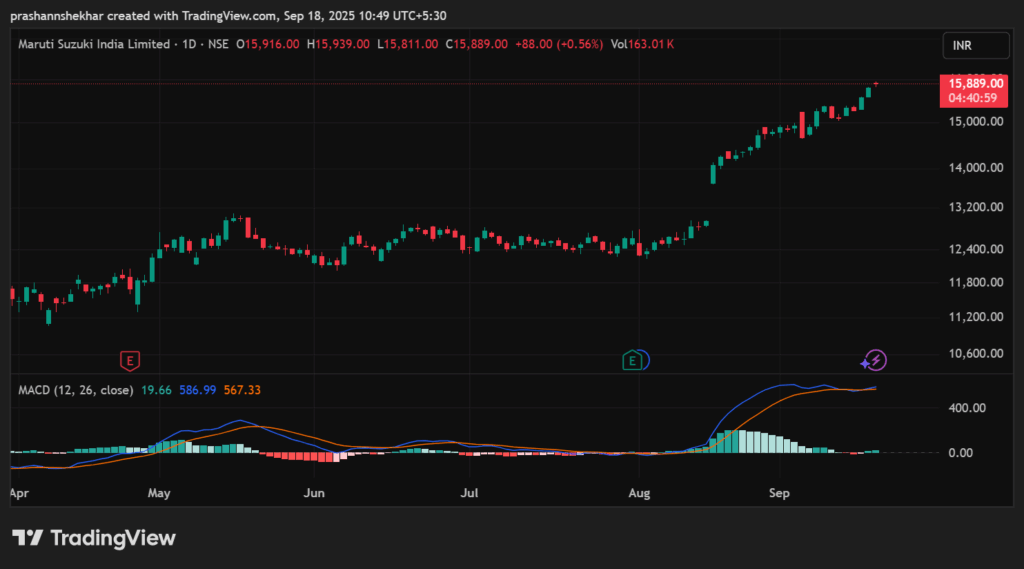
🔹 How to Read MACD
- MACD Line & Signal Line
- When the MACD Line crosses above the Signal Line → Buy Signal
- When the MACD Line crosses below the Signal Line → Sell Signal
- MACD Histogram
- Shows the difference between the MACD Line & the Signal Line.
- Expanding bars → Strong momentum.
- Contracting bars → Weakening momentum.
- Zero Line
- When the MACD Line is above zero → Uptrend.
- When the MACD Line is below zero → Downtrend.
🔹 Best MACD Settings
- Default Settings: 12, 26, 9 (most widely used).
- Intraday Traders (5min/15min): 8, 21, 5 (faster signals).
- Swing Traders (Daily charts): 12, 26, 9 (balanced).
💡 Tip: Avoid over-optimizing MACD; default settings work well for most traders.
🔹 MACD Trading Strategies
1. MACD Crossover Strategy
- Buy when the MACD Line crosses above the Signal Line.
- Sell when the MACD Line crosses below the Signal Line.
- Works best in trending markets.
2. MACD Zero Line Strategy
- When MACD crosses above zero → bullish trend confirmation.
- When MACD crosses below zero → bearish trend confirmation.
- Helps filter out false signals.
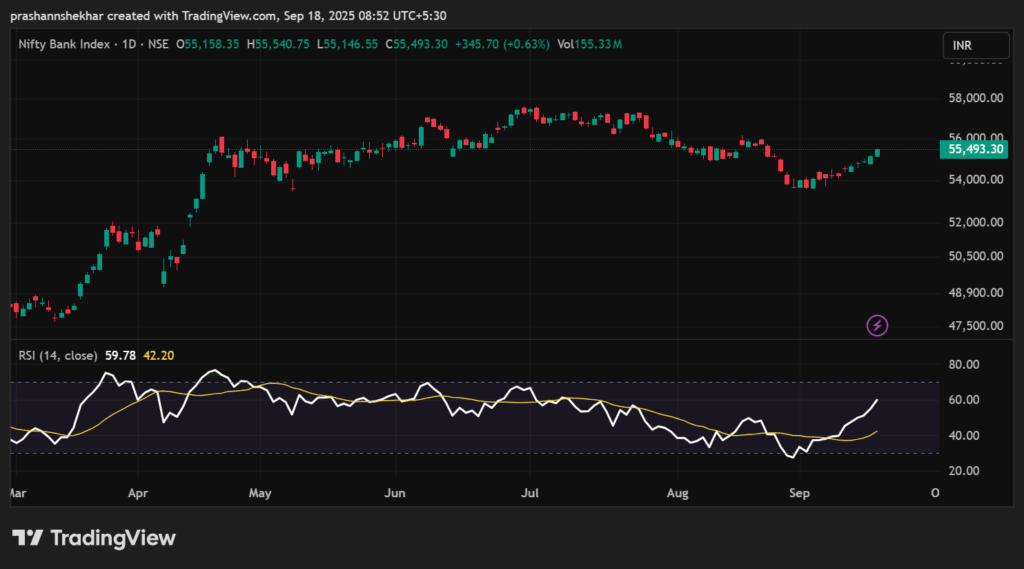
3. MACD + RSI Strategy
- Combine MACD with RSI (Relative Strength Index) for higher accuracy.
- Example: Buy when the MACD crossover is bullish + RSI above 55.
- Sell when MACD crossover is bearish + RSI below 45.
4. MACD Divergence Strategy
- Bullish Divergence: Price makes lower lows, but MACD makes higher lows → Trend reversal upward.
- Bearish Divergence: Price makes higher highs, but MACD makes lower highs → Trend reversal downward.
🔹 Pros & Cons of MACD
✅ Advantages
- Simple and widely used indicator.
- Works across multiple timeframes.
- Helps identify both trend and momentum.
❌ Limitations
- It can give false signals in sideways markets.
- Works best when combined with other indicators.
- Divergences may appear early, requiring patience.
📊 Conclusion
The MACD Indicator is one of the most reliable technical tools for traders.
It helps identify trend direction, momentum, and potential reversals.
👉 For best results:
- Use MACD with RSI or Moving Averages.
- Trade only in trending markets.
- Always apply stop-loss to manage risk.
With practice, MACD can become a powerful weapon in your trading journey.
📌 Disclaimer: This blog is for educational purposes only. ArthVed 9X is not a SEBI-registered advisor. Please consult your financial advisor before making investment decisions.