📌 Introduction
When it comes to technical indicators, the Relative Strength Index (RSI) is one of the most widely used tools in trading. Introduced by J. Welles Wilder, RSI is a momentum oscillator that helps traders measure the speed and strength of price movements.
Whether you are an intraday trader, swing trader, or investor, understanding RSI can give you an edge in spotting trend reversals and avoiding false entries.
🔹 What is RSI in Trading?
RSI stands for Relative Strength Index. It is a momentum oscillator that ranges from 0 to 100 and is used to identify:
- Overbought conditions (RSI above 70 → stock may be overvalued and due for correction).
- Oversold conditions (RSI below 30 → stock may be undervalued and due for a bounce).
👉 In simple words: RSI tells you when a stock is running “too hot” or “too cold.”
🔹 RSI Formula (Simplified)
RSI is calculated using the average gains and losses over a selected period (commonly 14 periods). RSI=100−1001+RSRSI = 100 – \frac{100}{1 + RS}RSI=100−1+RS100
Where RS = Average Gain ÷ Average Loss
⚡ Don’t worry—you don’t need to calculate it manually. Charting platforms like TradingView and ArthVed 9X tools plot RSI automatically.
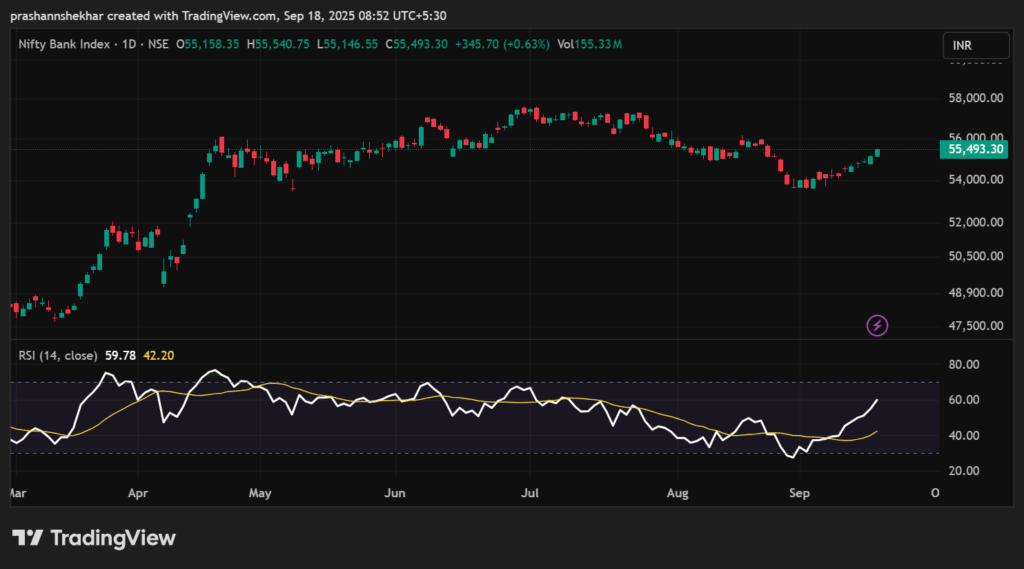
🔹 How to Read RSI Levels
- Above 70 → Overbought Zone (possible trend reversal or pullback).
- Below 30 → Oversold Zone (possible bounce or reversal).
- 50 Level → Neutral Zone (used as a trend filter).
💡 Many traders also watch the RSI 60–40 range to identify bullish/bearish strength.
🔹 How to Use RSI in Trading
1. Overbought and Oversold Strategy
- When RSI crosses above 70, it may indicate the stock is overbought → a potential sell signal.
- When RSI drops below 30, it may indicate the stock is oversold → a potential buy signal.
⚠️ But note: In strong trends, RSI can remain overbought/oversold for a long time. Always confirm with other indicators.
2. RSI Divergence Strategy
RSI divergence occurs when the price and RSI move in opposite directions:
- Bullish Divergence: Price makes a lower low, but RSI makes a higher low → possible reversal upwards.
- Bearish Divergence: Price makes a higher high, but RSI makes a lower high → possible reversal downwards.
👉 Divergence is a powerful signal for early entry before the trend changes.
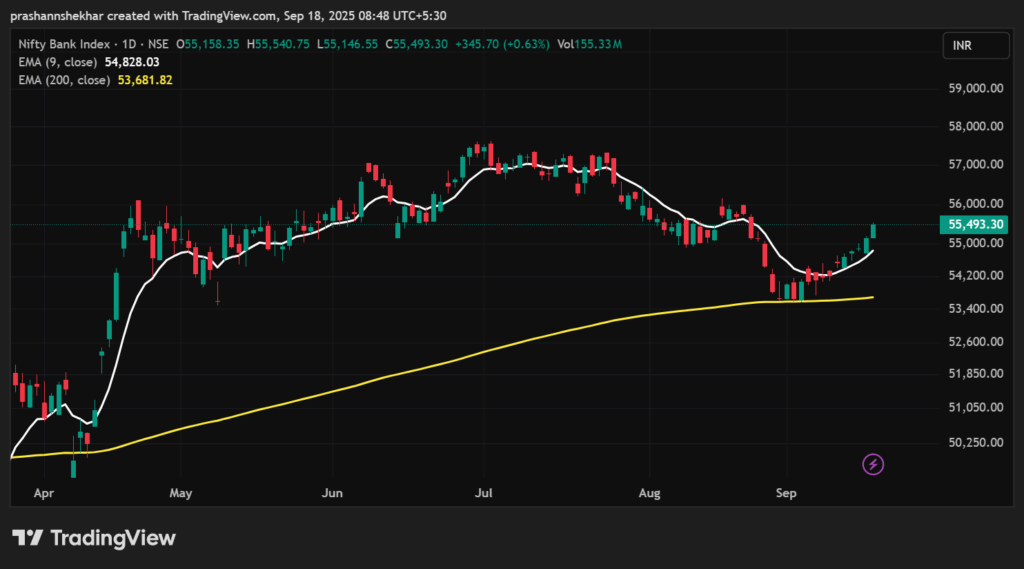
3. RSI with Moving Averages (Filter)
Combine RSI with EMA or SMA for better accuracy.
Example setup:
- Buy when RSI > 50 and price is above 20 EMA.
- Sell when RSI < 50 and price is below 20 EMA.
4. RSI Swing Rejection Strategy
This advanced method looks for RSI to cross 30/70 levels and then reject back.
Example:
- RSI goes below 30 → comes back above 30 → bullish rejection (buy).
- RSI goes above 70 → comes back below 70 → bearish rejection (sell).
🔹 Best RSI Settings for Traders
- Default RSI Period: 14 (standard).
- Intraday Traders (5-min/15-min): Use RSI 9 or RSI 14 for faster signals.
- Swing Traders: RSI 14 or 21 works best on daily charts.
- Positional Traders: RSI 14 on weekly/monthly charts.
🔹 Advantages of RSI
✅ Easy to understand and apply.
✅ Works across all timeframes (intraday, swing, positional).
✅ Helps spot early trend reversals.
✅ Powerful when combined with moving averages or candlestick patterns.
🔹 Limitations of RSI
❌ Can give false signals in strong trending markets.
❌ Overbought/oversold does not always mean immediate reversal.
❌ Best used with confirmation (trendlines, volume, support/resistance).
📊 Conclusion
The Relative Strength Index (RSI) is one of the most reliable momentum indicators for traders. It helps you spot overbought and oversold conditions, identify divergences, and confirm trend strength.
👉 But remember: RSI should not be used in isolation. Combine it with Moving Averages, Support/Resistance, or Volume analysis for better results.
📌 Disclaimer: This blog is for educational purposes only. ArthVed 9X is not a SEBI-registered advisor. Please consult your financial advisor before making investment decisions.