📌 Introduction
In the stock market, price tells you what is happening, but volume tells you why it’s happening.
Volume is one of the most important indicators in technical analysis as it shows the strength behind price movements.
Whether you’re trading intraday or holding for the short term, volume analysis helps confirm trends, spot breakouts, and avoid false signals.
🔹 What is Volume in the Stock Market?
Volume represents the total number of shares traded during a given time period (e.g., 1 minute, 15 minutes, daily).
- High Volume → Strong interest in a stock confirms the move.
- Low Volume → Weak interest, possible sideways movement.
For example:
- If Reliance rises from ₹2,500 to ₹2,550 on high volume, it shows strong buying interest.
- If the same rise happens on low volume, it may not sustain.
🔹 Why is Volume Important in Trading?
- Confirms Trend Direction
- Rising prices with high volume → Strong uptrend.
- Falling prices with high volume → Strong downtrend.
- Identifies Breakouts & Breakdowns
- A breakout above resistance is reliable only when supported by high volume.
- Without volume, breakouts are often false.
- Reveals Reversals
- Sudden spikes in volume after a long trend may indicate a reversal.
🔹 How to Read Volumes
- Volume Spikes
- A sudden increase in volume shows heavy buying/selling.
- Watch if price confirms the direction.
- Volume + Price Relationship
- Price ↑ + Volume ↑ → Bullish confirmation.
- Price ↑ + Volume ↓ → Weak uptrend, possible reversal.
- Price ↓ + Volume ↑ → Bearish confirmation.
- Price ↓ + Volume ↓ → Weak downtrend.
🔹 Popular Volume-Based Indicators
- On-Balance Volume (OBV): Cumulative volume indicator to confirm trend.
- Volume Weighted Average Price (VWAP): Average price weighted by volume, used in intraday trading.
- Volume Oscillator: Measures the difference between two volume moving averages.
🔹 Volume Trading Strategies
1. Volume Breakout Strategy
- Buy when the stock breaks resistance with high volume.
- Example: Nifty breaks 20,000 level with heavy volume → bullish confirmation.
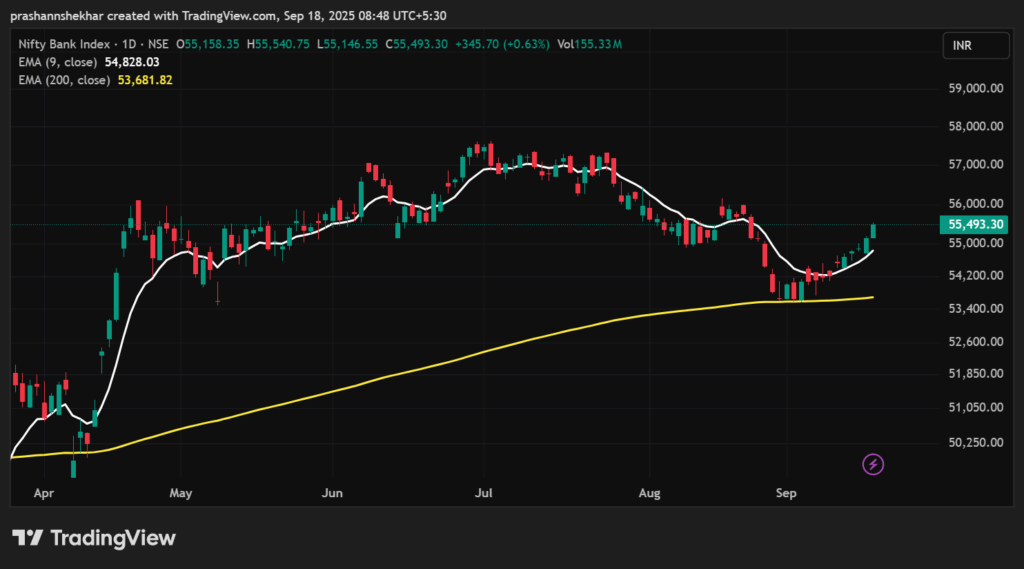
2. Volume with Moving Averages
- Combine 50 EMA + Volume.
- If price crosses 50 EMA with strong volume → High probability trade.
3. Volume Divergence
- If price makes new highs but volume does not → Trend may be weakening.
- If price makes new lows but volume is low → Weak downtrend.
🔹 Pros & Cons of Using Volume
✅ Advantages
- Confirms the strength of price moves.
- Helps identify real vs false breakouts.
- Works across all timeframes.
❌ Limitations
- Volume data can sometimes be delayed.
- Needs to be combined with other indicators for accuracy.
📊 Conclusion
Volume is the backbone of technical analysis.
While price shows the direction, volume confirms the conviction behind the move.
👉 For best results:
- Always check volume confirmation in breakouts/breakdowns.
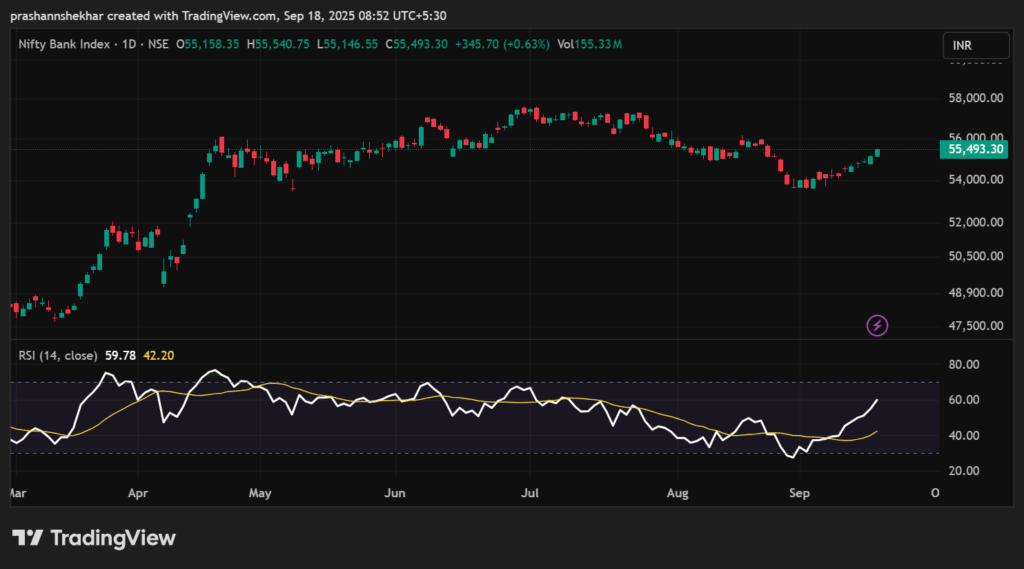
- Use volume with indicators like VWAP, Moving Averages, or RSI.
- Avoid trading solely based on volume without price action.
With consistent practice, volume analysis can help you trade smarter and avoid traps in the stock market.
📌 Disclaimer: This blog is for educational purposes only. ArthVed 9X is not a SEBI-registered advisor. Please consult your financial advisor before making investment decisions.