Author name: Fouses Support Team

Strategies

Moving Average Crossovers – How to Spot Trend Shift Signals
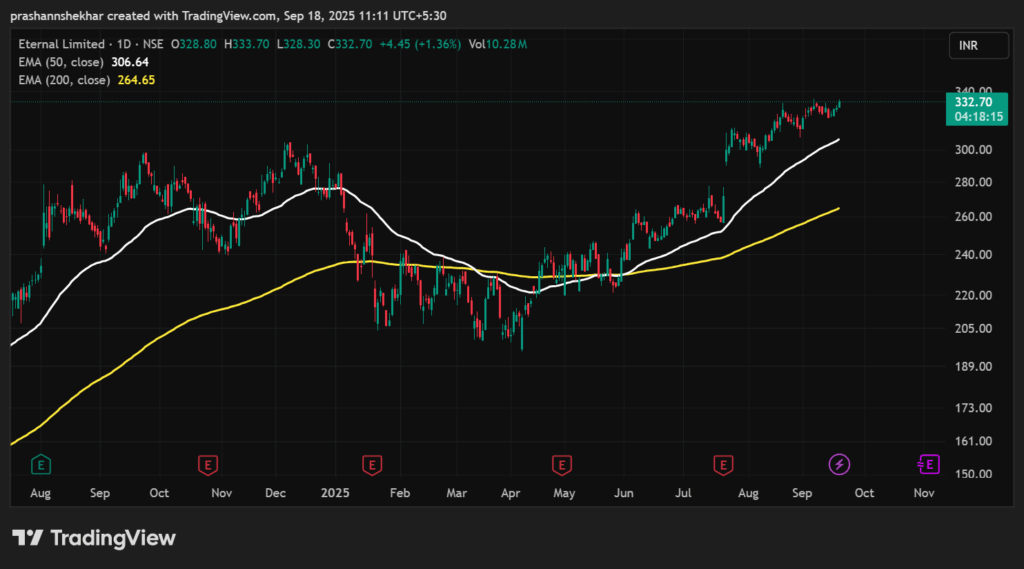
πŸ“Œ Introduction One of the simplest and most effective ways to identify trend shifts in the stock market is by using Moving Average Crossovers. When two moving averages cross each other, it often signals a change in momentum. Traders use this to spot buying opportunities in uptrends and selling opportunities in downtrends. Whether you’re a beginner or an experienced trader, crossover strategies are easy to understand and widely used. πŸ”Ή What is a Moving Average Crossover? A moving average crossover occurs when a short-term moving average (fast MA) crosses over a long-term moving average (slow MA). πŸ‘‰ Example: πŸ”Ή Best Moving Average Combinations πŸ”Ή Types of Crossovers πŸ”Ή Moving Average Crossover Strategies 1. Golden Cross Strategy 2. Intraday Crossover Strategy 3. Crossover with RSI Filter 4. Crossover with Volume Confirmation πŸ”Ή Pros & Cons of Crossover Trading βœ… Advantages ❌ Limitations πŸ“Š Conclusion Moving Average Crossovers are one of the most reliable ways to detect trend shifts in the stock market. πŸ‘‰ For best results: With patience and discipline, crossover signals can help you catch major trend reversals and improve trading accuracy. πŸ“Œ Disclaimer: This blog is for educational purposes only. ArthVed 9X is not a SEBI-registered advisor. Please consult your financial advisor before making investment decisions.

Strategies

Volumes – The Fuel Behind Price

πŸ“Œ Introduction In the stock market, price tells you what is happening, but volume tells you why it’s happening.Volume is one of the most important indicators in technical analysis as it shows the strength behind price movements. Whether you’re trading intraday or holding for the short term, volume analysis helps confirm trends, spot breakouts, and avoid false signals. πŸ”Ή What is Volume in the Stock Market? Volume represents the total number of shares traded during a given time period (e.g., 1 minute, 15 minutes, daily). For example: πŸ”Ή Why is Volume Important in Trading? πŸ”Ή How to Read Volumes πŸ”Ή Popular Volume-Based Indicators πŸ”Ή Volume Trading Strategies 1. Volume Breakout Strategy 2. Volume with Moving Averages 3. Volume Divergence πŸ”Ή Pros & Cons of Using Volume βœ… Advantages ❌ Limitations πŸ“Š Conclusion Volume is the backbone of technical analysis.While price shows the direction, volume confirms the conviction behind the move. πŸ‘‰ For best results: With consistent practice, volume analysis can help you trade smarter and avoid traps in the stock market. πŸ“Œ Disclaimer: This blog is for educational purposes only. ArthVed 9X is not a SEBI-registered advisor. Please consult your financial advisor before making investment decisions.

Strategies

MACD Indicator Explained: How to Use MACD for Profitable Trading

πŸ“Œ Introduction One of the most powerful tools in technical analysis is the MACD (Moving Average Convergence Divergence) indicator.It helps traders identify trend direction, strength, and momentum shifts. Whether you’re an intraday trader or a swing trader, MACD can help you spot early trading opportunities with high accuracy. πŸ”Ή What is MACD? The MACD Indicator is a momentum and trend-following indicator developed by Gerald Appel.It is based on the difference between two exponential moving averages (EMAs). πŸ‘‰ Formula: πŸ”Ή How to Read MACD πŸ”Ή Best MACD Settings πŸ’‘ Tip: Avoid over-optimizing MACD; default settings work well for most traders. πŸ”Ή MACD Trading Strategies 1. MACD Crossover Strategy 2. MACD Zero Line Strategy 3. MACD + RSI Strategy 4. MACD Divergence Strategy πŸ”Ή Pros & Cons of MACD βœ… Advantages ❌ Limitations πŸ“Š Conclusion The MACD Indicator is one of the most reliable technical tools for traders.It helps identify trend direction, momentum, and potential reversals. πŸ‘‰ For best results: With practice, MACD can become a powerful weapon in your trading journey. πŸ“Œ Disclaimer: This blog is for educational purposes only. ArthVed 9X is not a SEBI-registered advisor. Please consult your financial advisor before making investment decisions.

Strategies

Supertrend Indicator – The Trend Companion

πŸ“Œ Introduction In trading, the trend is your best friend. But how do you know when a trend is changing? That’s where the Supertrend Indicator comes in. The Supertrend is a trend-following indicator that gives clear buy and sell signals directly on the chart. It works well in intraday, swing, and positional trading. πŸ”Ή What is the Supertrend Indicator? The Supertrend Indicator is based on Average True Range (ATR), which measures volatility. It works best in trending markets but can give false signals in sideways markets. πŸ”Ή How Does Supertrend Work? The Supertrend has two main parameters: πŸ‘‰ Formula: πŸ”Ή Best Supertrend Settings πŸ’‘ Tip: Always backtest before applying to live trades. πŸ”Ή How to Use Supertrend – Buy & Sell Signals βœ… Buy Signal ❌ Sell Signal πŸ”Ή Supertrend Trading Strategies 1. Supertrend + Moving Average 2. Supertrend + RSI 3. Dual Supertrend Strategy πŸ”Ή Pros & Cons of Supertrend βœ… Advantages ❌ Limitations πŸ“Š Conclusion The Supertrend Indicator is one of the simplest and most effective tools for traders. It helps identify the direction of the trend and gives clear entry and exit signals. πŸ‘‰ For best results: πŸ“Œ Disclaimer: This blog is for educational purposes only. ArthVed 9X is not a SEBI-registered advisor. Please consult your financial advisor before making investment decisions.

Strategies

Breakout and Breakdown Trading

πŸ“Œ Introduction Every trader dreams of catching that big move when a stock suddenly surges or falls with strong momentum. These moves usually happen during a breakout or breakdown. A breakout occurs when the price moves above a defined resistance level, while a breakdown happens when the price falls below a support level. Both are powerful signals for traders, especially in intraday and swing trading. πŸ”Ή What is a Breakout in Trading? A breakout happens when the stock price moves above a resistance level with higher-than-average volume. πŸ‘‰ Example: If Nifty has been struggling to cross 20,000 for weeks and suddenly breaks above it with strong volume β†’ breakout. πŸ”Ή What is a Breakdown in Trading? A breakdown is the opposite of a breakout. It happens when the stock price falls below a support level with strong selling pressure. πŸ‘‰ Example: If Bank Nifty is holding at 45,000 but crashes below that level with heavy volume β†’ breakdown. πŸ”Ή How to Identify Breakouts and Breakdowns πŸ”Ή Popular Breakout & Breakdown Strategies 1. Range Breakout Strategy 2. Chart Pattern Breakouts 3. Retest Strategy (Safer Entry) Many traders prefer waiting for a retest after a breakout/breakdown. Example: 4. Breakout with Indicators Combine breakouts with other indicators: πŸ”Ή Common Mistakes Traders Make ❌ Jumping in without volume confirmation.❌ Ignoring false breakouts (traps by big players).❌ Not setting stop-loss (breakouts fail often).❌ Entering late after the move is already gone. πŸ”Ή Risk Management in Breakout Trading πŸ“Š Conclusion Breakouts and breakdowns are among the most profitable setups in trading when used with discipline. By combining support/resistance, chart patterns, and volume analysis, traders can catch big trending moves early. πŸ‘‰ But remember: Not all breakouts succeed. Always manage risk with stop-loss and wait for confirmation. πŸ“Œ Disclaimer: This blog is for educational purposes only. ArthVed 9X is not a SEBI-registered advisor. Please consult your financial advisor before making investment decisions.

Strategies

Fibonacci Retracement – Hidden Market Levels

πŸ“Œ Introduction Have you ever wondered why stocks often bounce back or reverse at certain price levels? It’s not magic β€” it’s Fibonacci Retracement at work. Based on the famous Fibonacci sequence, this tool is one of the most widely used in technical analysis. Traders use Fibonacci retracement levels to identify potential support and resistance zones, making it a must-know concept for both intraday and swing traders. πŸ”Ή What is Fibonacci Retracement? Fibonacci Retracement is a technical tool that plots horizontal levels on a chart, based on the mathematical ratios derived from the Fibonacci sequence. The most commonly used Fibonacci retracement levels are: πŸ‘‰ These levels act as support in uptrends and resistance in downtrends. πŸ”Ή How to Draw Fibonacci Retracement πŸ’‘ Example: If a stock rises from β‚Ή100 to β‚Ή200, and then starts correcting: πŸ”Ή How Traders Use Fibonacci Levels 1. Finding Support and Resistance 2. Trend Continuation Strategy In an uptrend: In a downtrend: 3. Confluence Trading Fibonacci works best when combined with other tools. Examples: 4. Target Projection Many traders also use Fibonacci extensions (161.8%, 261.8%) to set profit targets after a breakout. πŸ”Ή Advantages of Fibonacci Retracement βœ… Easy to plot and widely used.βœ… Helps identify natural support and resistance zones.βœ… Works across intraday, swing, and positional trading.βœ… Powerful when combined with RSI, MACD, or Volume. πŸ”Ή Limitations of Fibonacci Retracement ❌ Subjective β€” different traders may choose different swing highs/lows.❌ Levels are not guaranteed β€” price may ignore them.❌ Should never be used alone; confirmation is a must. πŸ“Š Conclusion Fibonacci Retracement is one of the most reliable tools for predicting market pullbacks and continuations. By marking key retracement levels like 38.2%, 50%, and 61.8%, traders can identify high-probability support and resistance zones. πŸ‘‰ But remember: Fibonacci should always be combined with other indicators, price action, and risk management. πŸ“Œ Disclaimer: This blog is for educational purposes only. ArthVed 9X is not a SEBI-registered advisor. Please consult your financial advisor before making investment decisions.

Strategies

Bollinger Bands in Trading – A Complete Guide for Beginners

πŸ“Œ Introduction Markets are never still β€” they expand, contract, and move in cycles of volatility. To capture these movements, traders often rely on Bollinger Bands. Created by John Bollinger, Bollinger Bands are one of the most popular volatility indicators. They help traders understand whether prices are high or low relative to previous levels and identify potential breakouts, reversals, and trend continuations. πŸ”Ή What are Bollinger Bands? Bollinger Bands consist of three lines plotted on a price chart: πŸ‘‰ The bands automatically expand during high volatility and contract during low volatility. πŸ”Ή How to Read Bollinger Bands πŸ”Ή Popular Bollinger Band Strategies 1. Bollinger Band Squeeze (Breakout Strategy) When the bands contract tightly, it signals low volatility. This is often followed by a sharp breakout. πŸ‘‰ Many intraday traders love this setup for momentum trades. 2. Bollinger Band Bounce (Reversal Strategy) In range-bound markets, the price tends to bounce between the upper and lower bands. ⚠️ Works best in sideways markets, not in strong trends. 3. Bollinger Bands with RSI Combining Bollinger Bands with RSI improves accuracy. 4. Bollinger Band Riding (Trend Strategy) In strong trends, prices β€œride the band”: πŸ‘‰ Don’t fight the trend if price is riding the bands. πŸ”Ή Best Settings for Bollinger Bands πŸ’‘ Pro Tip: Adjust band settings based on stock volatility. Higher volatility = wider bands. πŸ”Ή Advantages of Bollinger Bands βœ… Works in all timeframes.βœ… Helps identify volatility shifts.βœ… Useful for both breakout and reversal trading.βœ… Easy to combine with RSI, MACD, or Volume. πŸ”Ή Limitations of Bollinger Bands ❌ Not a standalone indicator β€” needs confirmation.❌ In strong trends, overbought/oversold signals can mislead.❌ False breakouts are common during news events. πŸ“Š Conclusion Bollinger Bands are an essential tool for every trader’s toolkit. They help you: πŸ‘‰ But remember: Always combine Bollinger Bands with other tools like RSI, MACD, or Volume for better accuracy. πŸ“Œ Disclaimer: This blog is for educational purposes only. ArthVed 9X is not a SEBI-registered advisor. Please consult your financial advisor before making investment decisions.

Strategies

RSI (Relative Strength Index) in Trading – A Complete Beginner’s Guide

πŸ“Œ Introduction When it comes to technical indicators, the Relative Strength Index (RSI) is one of the most widely used tools in trading. Introduced by J. Welles Wilder, RSI is a momentum oscillator that helps traders measure the speed and strength of price movements. Whether you are an intraday trader, swing trader, or investor, understanding RSI can give you an edge in spotting trend reversals and avoiding false entries. πŸ”Ή What is RSI in Trading? RSI stands for Relative Strength Index. It is a momentum oscillator that ranges from 0 to 100 and is used to identify: πŸ‘‰ In simple words: RSI tells you when a stock is running β€œtoo hot” or β€œtoo cold.” πŸ”Ή RSI Formula (Simplified) RSI is calculated using the average gains and losses over a selected period (commonly 14 periods). RSI=100βˆ’1001+RSRSI = 100 – \frac{100}{1 + RS}RSI=100βˆ’1+RS100​ Where RS = Average Gain Γ· Average Loss ⚑ Don’t worryβ€”you don’t need to calculate it manually. Charting platforms like TradingView and ArthVed 9X tools plot RSI automatically. πŸ”Ή How to Read RSI Levels πŸ’‘ Many traders also watch the RSI 60–40 range to identify bullish/bearish strength. πŸ”Ή How to Use RSI in Trading 1. Overbought and Oversold Strategy ⚠️ But note: In strong trends, RSI can remain overbought/oversold for a long time. Always confirm with other indicators. 2. RSI Divergence Strategy RSI divergence occurs when the price and RSI move in opposite directions: πŸ‘‰ Divergence is a powerful signal for early entry before the trend changes. 3. RSI with Moving Averages (Filter) Combine RSI with EMA or SMA for better accuracy. Example setup: 4. RSI Swing Rejection Strategy This advanced method looks for RSI to cross 30/70 levels and then reject back. Example: πŸ”Ή Best RSI Settings for Traders πŸ”Ή Advantages of RSI βœ… Easy to understand and apply.βœ… Works across all timeframes (intraday, swing, positional).βœ… Helps spot early trend reversals.βœ… Powerful when combined with moving averages or candlestick patterns. πŸ”Ή Limitations of RSI ❌ Can give false signals in strong trending markets.❌ Overbought/oversold does not always mean immediate reversal.❌ Best used with confirmation (trendlines, volume, support/resistance). πŸ“Š Conclusion The Relative Strength Index (RSI) is one of the most reliable momentum indicators for traders. It helps you spot overbought and oversold conditions, identify divergences, and confirm trend strength. πŸ‘‰ But remember: RSI should not be used in isolation. Combine it with Moving Averages, Support/Resistance, or Volume analysis for better results. πŸ“Œ Disclaimer: This blog is for educational purposes only. ArthVed 9X is not a SEBI-registered advisor. Please consult your financial advisor before making investment decisions.

Strategies

Moving Averages – The Foundation of Technical Analysis

πŸ“Œ Introduction If there is one technical indicator that almost every trader has on their chart, it is the Moving Average (MA). Simple yet powerful, moving averages help traders smooth price data, identify trends, and filter out market noise. Whether you’re a beginner or an experienced trader, understanding moving averages is a must. In this blog, we’ll cover everything you need to know about moving averages, their types, and how to use them effectively in intraday and swing trading. πŸ”Ή What is a Moving Average? A Moving Average is a statistical calculation that takes the average price of a stock (or any asset) over a specific number of periods and keeps updating as new data comes in. πŸ‘‰ In simple words: It’s a line plotted on your chart that helps you identify the overall direction of the market. πŸ”Ή Types of Moving Averages 1. Simple Moving Average (SMA) 2. Exponential Moving Average (EMA) 3. Weighted Moving Average (WMA) πŸ”Ή How to Use Moving Averages in Trading 1. Trend Identification πŸ‘‰ Example: Many traders use the 200-day SMA to identify whether a stock is in a long-term bullish or bearish phase. 2. Dynamic Support and Resistance Moving averages often act as support in an uptrend and resistance in a downtrend. 3. Moving Average Crossovers Crossovers are among the most popular strategies in trading. ⚠️ Works best in trending markets, but may give false signals in sideways markets. 4. Intraday Trading with EMA Intraday traders often prefer EMA because of its sensitivity to price. Example setup: πŸ”Ή Advantages of Moving Averages βœ… Easy to use and understand.βœ… Works in all timeframes (intraday, swing, positional).βœ… Helps in identifying major support/resistance levels.βœ… Useful in trend-following systems. πŸ”Ή Limitations of Moving Averages ❌ Lagging indicator – always follows price.❌ Gives false signals in sideways or choppy markets.❌ Should not be used as a standalone tool – better when combined with RSI, MACD, or Volume. πŸ”Ή Best Moving Average Settings for Traders πŸ’‘ Pro Tip: Always backtest different MA settings on your favorite stocks before live trading. πŸ“Š Conclusion Moving Averages are the backbone of technical analysis. They not only help traders identify trends but also provide reliable support and resistance zones. However, they should never be used in isolation. Combine them with other indicators like RSI, MACD, or Volume for higher accuracy. πŸ“Œ Disclaimer: This blog is for educational purposes only. ArthVed 9X is not a SEBI-registered advisor. Please consult your financial advisor before making investment decisions.

Learnings

Getting Started in the Stock Market: A Step-by-Step Guide for Beginners

For anyone new to trading or investing, the stock market can seem overwhelming. But with the right approach, beginners can get started step by step. Step 1: Learn the basics of how the stock market works. Understand terms like shares, indices, brokers, and trading hours.Step 2: Open a demat and trading account with a trusted broker.Step 3: Start small β€” invest in a few companies you understand or track indices like Nifty 50 or Bank Nifty.Step 4: Learn how to read stock market charts and use simple tools like moving averages.Step 5: Practice discipline, risk management, and patience. The Indian stock market offers opportunities for everyone, but success comes only to those who treat trading as a skill to be developed β€” not a shortcut to riches.

Scroll to Top